
Introduction
Navigating the complexities of Human Resources data has always been a challenge that intrigued me. To tackle this, I embarked on a personal project to develop a comprehensive HR analytics dashboard using Tableau, aiming to transform raw data into actionable insights. This initiative was designed to enhance decision-making processes and provide strategic advantages through data visualization. Here, I’ll share my journey and insights from this experience and discuss my plans to transition the dashboard to Power BI for even greater capabilities.
Building the Dashboard
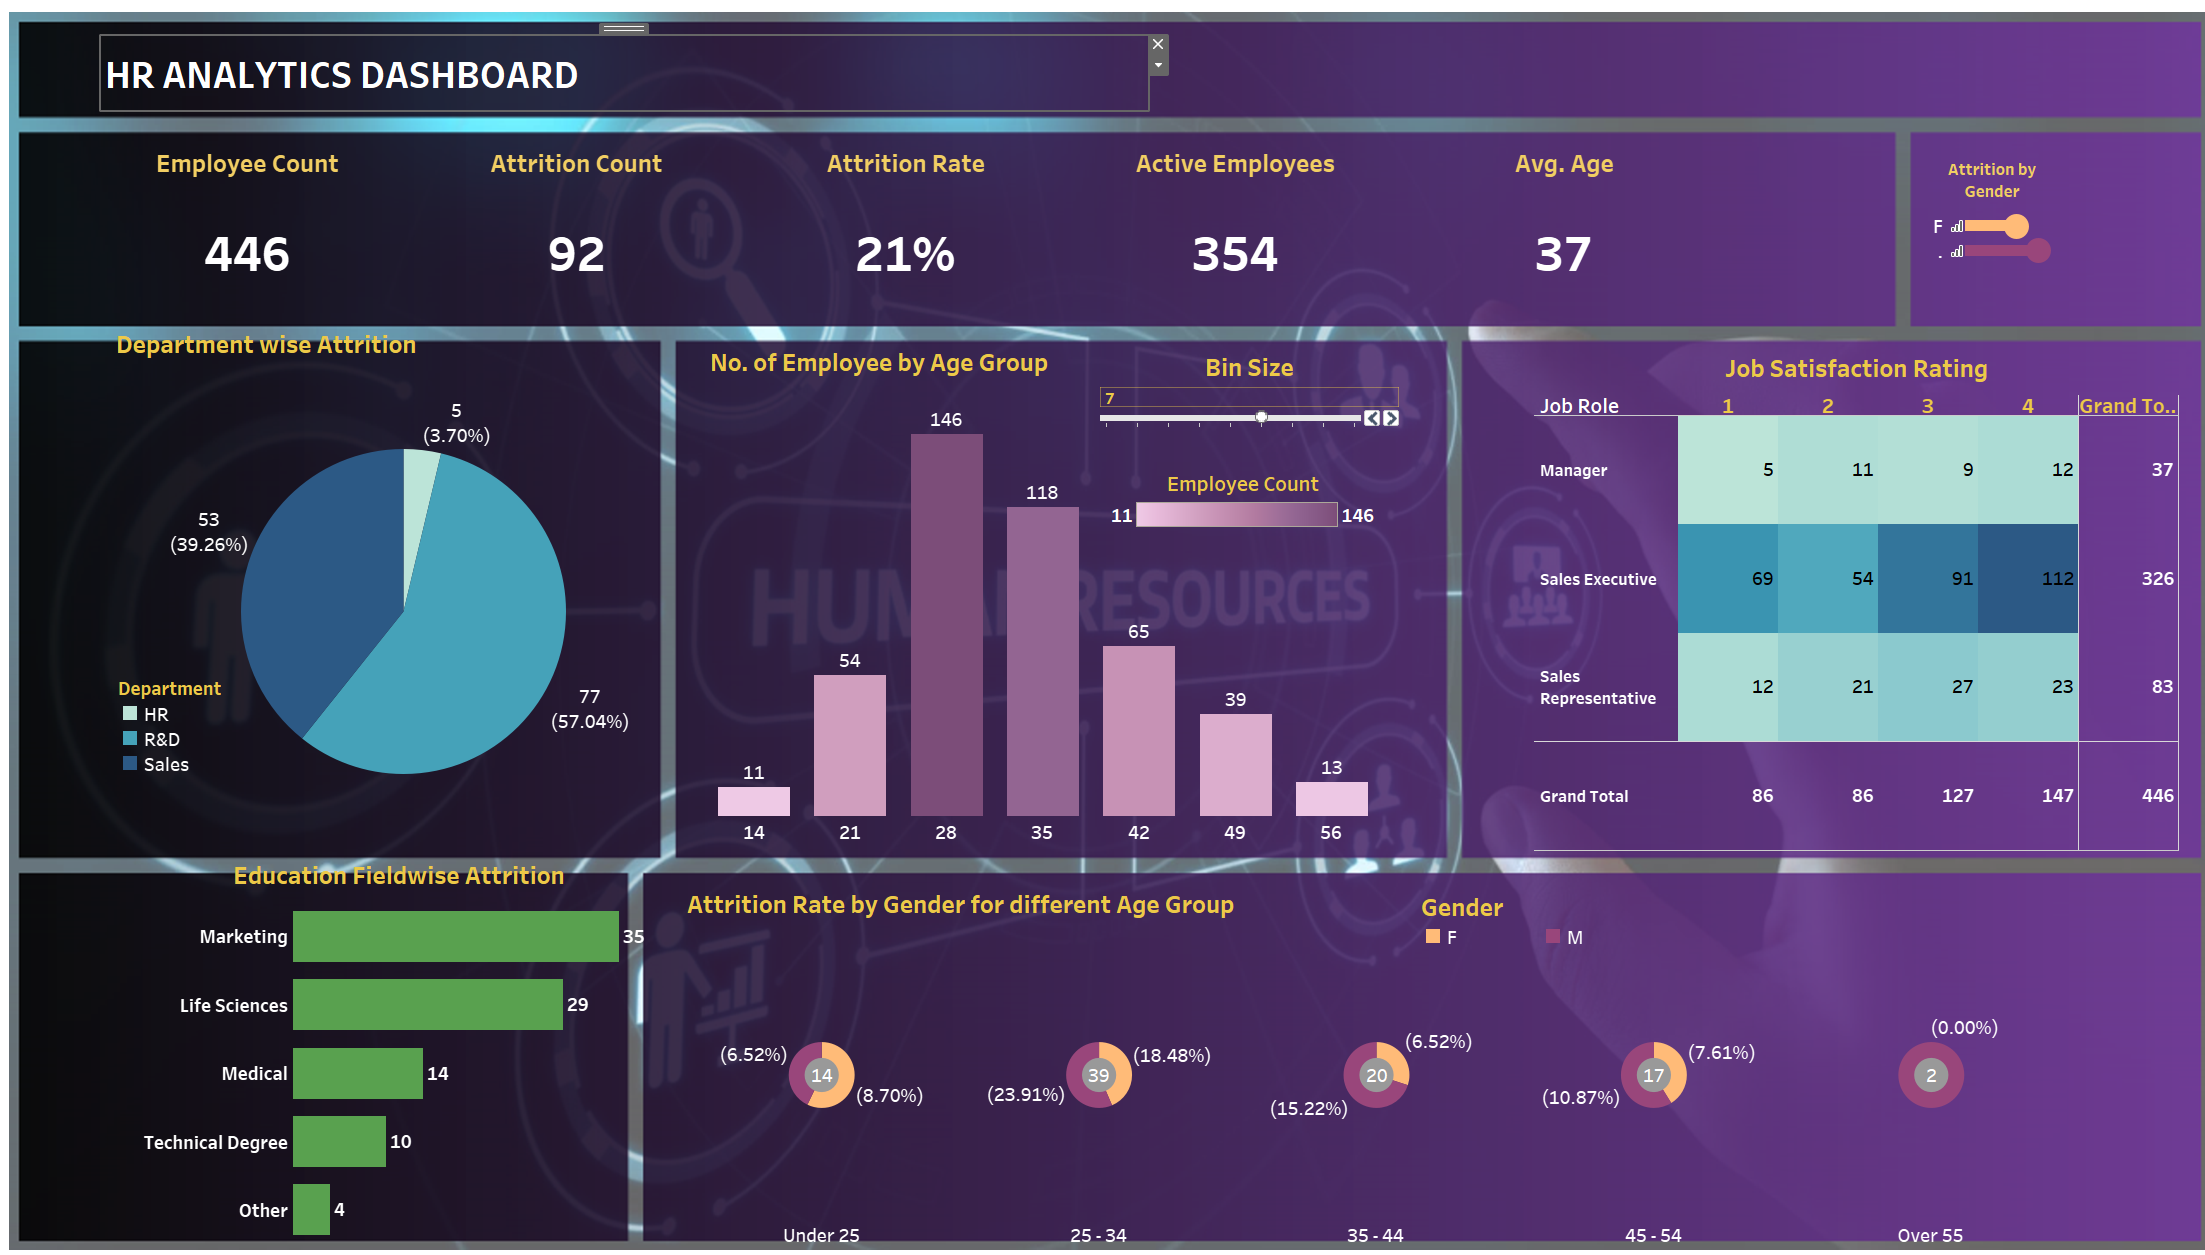
Creating the HR analytics dashboard involved synthesizing data from diverse sources like Excel spreadsheets and SQL databases. The goal was to provide a holistic view of key HR metrics including employee demographics, attrition rates, and job satisfaction levels. Here’s how I approached each section:
- Employee Demographics and Distribution: I integrated data to display detailed demographics, departmental distribution, and job roles. This segment was crucial for identifying workforce trends and planning resource allocation effectively.
- Attrition Analysis: The attrition module of the dashboard breaks down turnover rates by various dimensions such as department and role. This analysis is vital for understanding attrition patterns and developing retention strategies.
- Job Satisfaction: I incorporated a satisfaction matrix to assess employee contentment across different job roles. These insights are essential for maintaining a motivated workforce and identifying areas needing improvement.
Technical Integration and Challenges
Integrating data into the dashboard required robust data manipulation techniques to ensure compatibility and accuracy. I used SQL for structured queries and data extraction from databases, while Excel handled more dynamic datasets requiring frequent updates. The challenge was to maintain a seamless flow of data between these platforms, ensuring the dashboard remained up-to-date and reflective of current conditions.
Transitioning to Power BI
To enhance the dashboard’s functionality, I am planning to transition it to Power BI. This move is motivated by Power BI’s advanced AI analytics, superior real-time data processing capabilities, and its natural integration with other Microsoft services. Power BI’s mobile support and extensive visualization options will allow for better accessibility and more detailed predictive analytics.
Reflections and Future Directions
This project has not only improved HR decision-making within my scope but also deepened my understanding of data visualization’s impact on strategic planning. The upcoming shift to Power BI represents a significant step forward in my continuous pursuit of data excellence, promising to unlock new potentials for HR analytics.My journey in developing the HR analytics dashboard has been both challenging and rewarding. It underscored the transformative power of visual analytics in managing and interpreting HR data effectively.