
HR Dashboard Analytics – Tableau

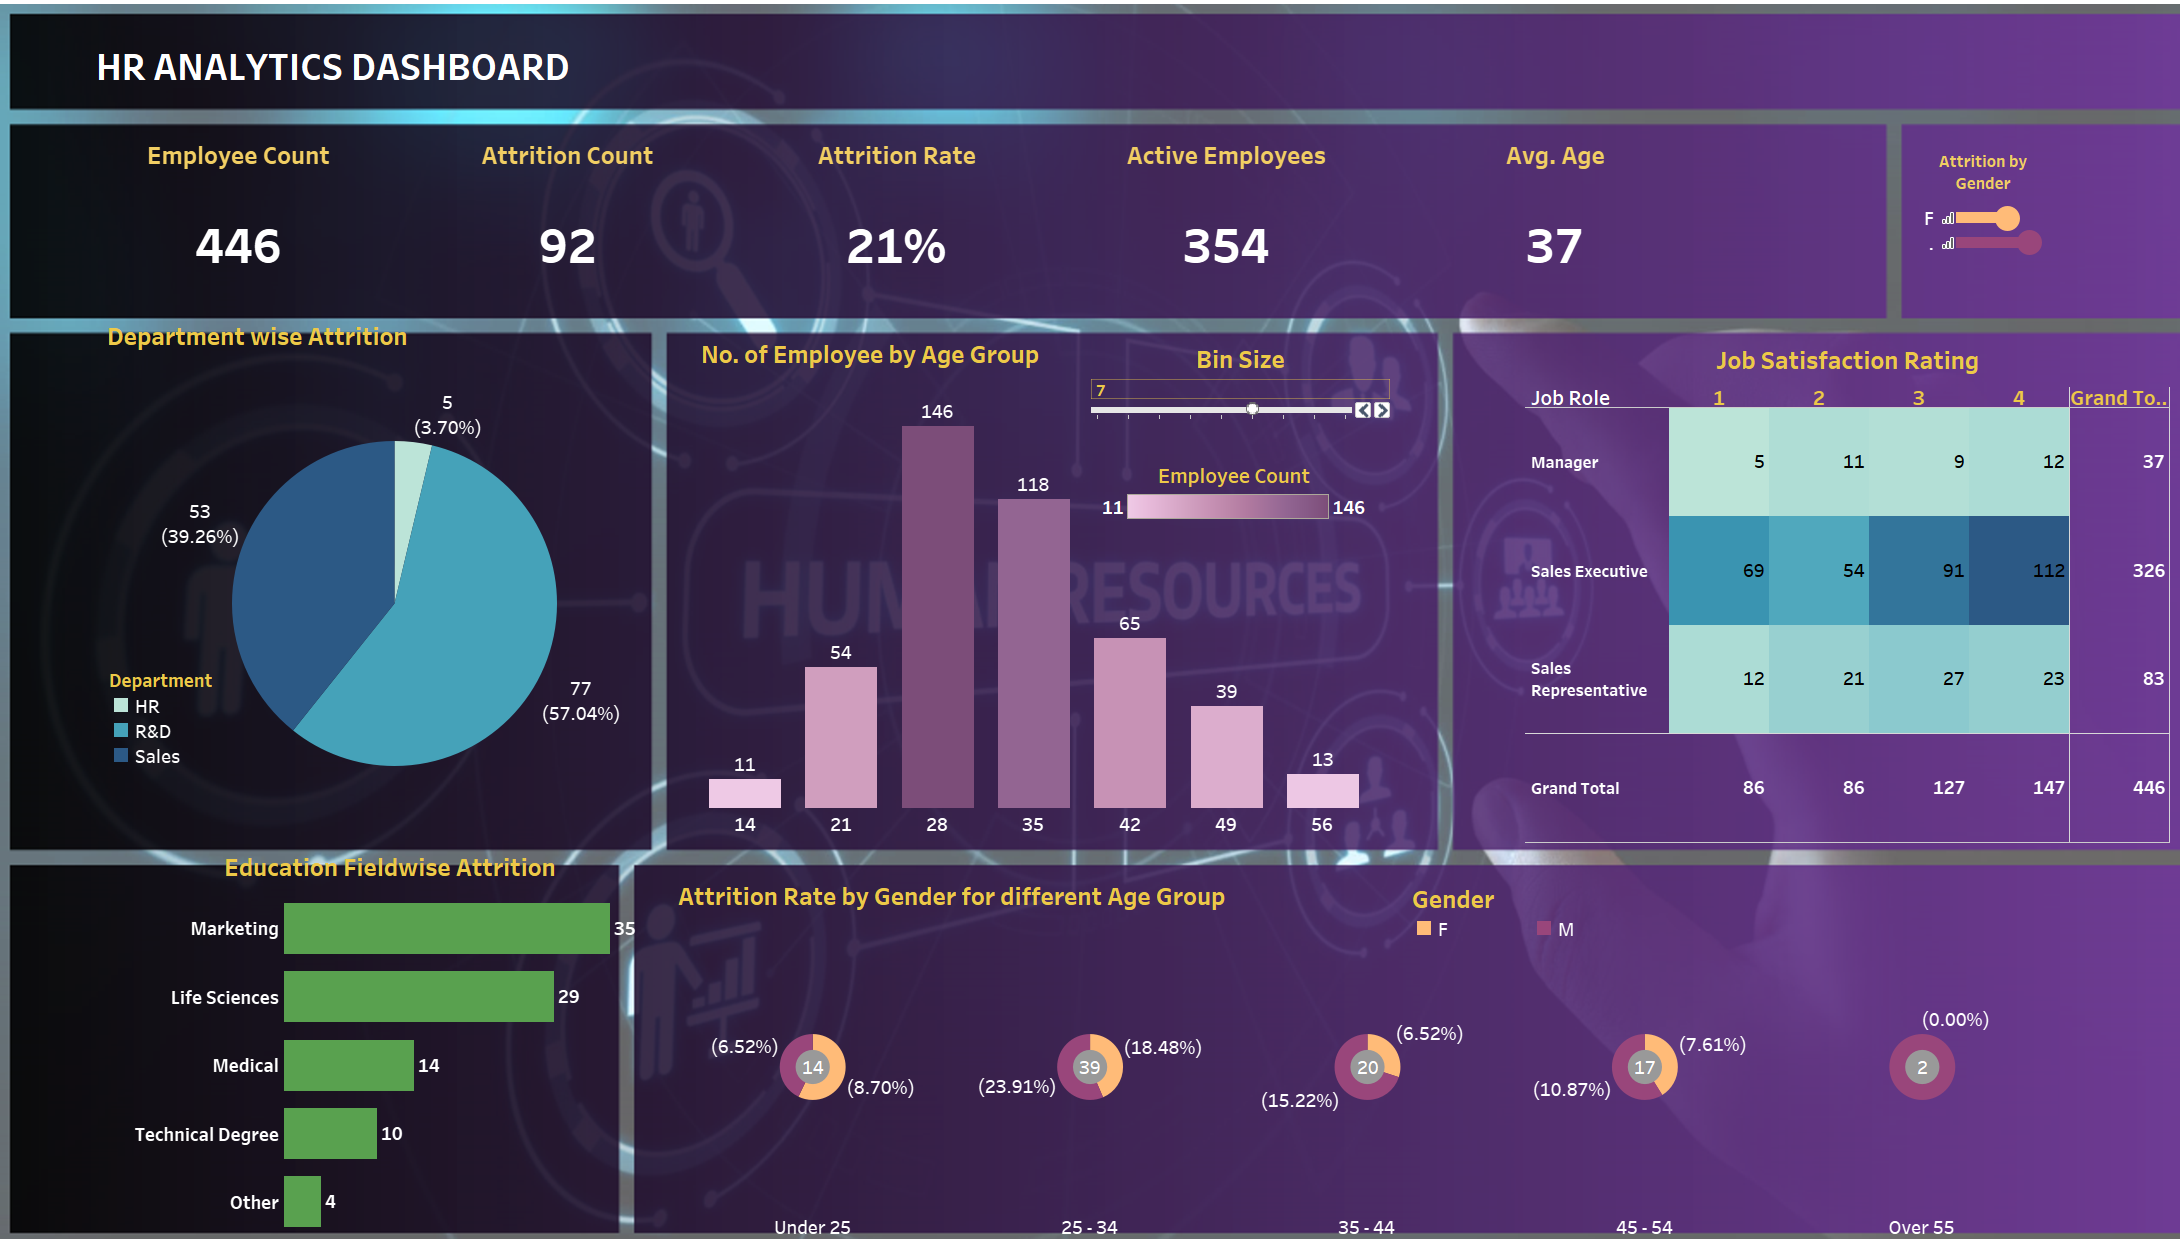
This HR Analytics Dashboard showcases key metrics including employee count, attrition rates, active employees, and average age. It breaks down attrition by department, education field, and age group, and even delves into job satisfaction ratings across different roles. The dashboards are meticulously designed in Tableau to offer a clear, concise, and interactive experience for stakeholders.
Category
Data Analytics
Client
JL Properties
Tools
PowerBI || Tablaeu
Developer
Frederick Larbi

PROJECT DESCRIPTION
The Tableau dashboards provide a comprehensive view of HR metrics, including detailed analyses of attrition rates across various demographics and job roles. The visualizations include pie charts, bar charts, heatmaps, and bin size controls to allow for interactive exploration of the data. As we continue to evolve our analytics capabilities, we plan to transition to Power BI, leveraging its robust data modeling, real-time dashboards, and advanced analytics features to complement and expand on the insights already available through Tableau. Power BI’s integration will facilitate seamless connectivity with various data sources, enhancing our ability to make informed decisions quickly and efficiently.